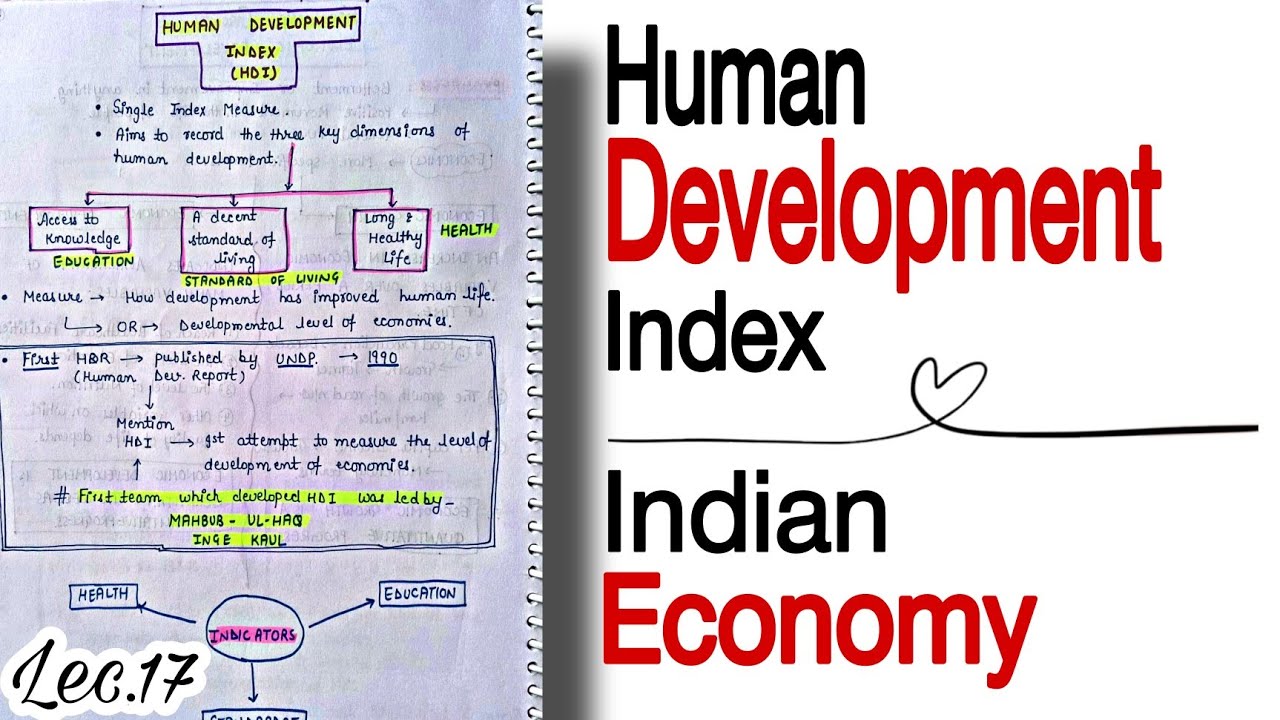
This simple guide explains the essential indicators of human resource development and shows how the Human Development Index (HDI) works. It is designed to help students preparing for competitive exams understand how the United Nations Development Programme (UNDP) started measuring real global progress beyond simple money or economic numbers in the late through its famous Human Development Report (HDR).
🎯 In this chapter, you will understand:
- How global progress shifted from simple economic growth to human well-being.
- The three main pillars used to calculate HDI: health, education, and standard of living.
- The mathematical steps and fixed minimum and maximum goalposts used to scale scores.
- How India's score is calculated step-by-step and how countries are divided into four tiers.
💡 Why this topic matters: It shifts our focus from how much money a country makes to how well its people actually live, learn, and grow.
🧠 Core Idea: The Human Development Index combines health, knowledge, and income into one simple score between 0 and 1 to compare living standards across different nations.
Indicators of Human Resource Development via Human Development Index 2010
When we look at global progress, Human Resource Development (HRD) and Human Development (HD) usually move together, even though they start from slightly different ideas. Because global data is easiest to gather through the United Nations Development Programme (UNDP), the Human Development Index works as our most reliable tool to see how well different countries take care of their people.
Understanding the global shift from purely economic metrics to a holistic human-centric philosophy through the proxy of HDI.
For decades, countries measured success only by looking at money, budgets, and factory outputs. The start of the HDI changed this completely by creating a system that puts human health and happiness at the very center of national plans.
- (i) People realized that healthy and educated citizens are the true wealth of any nation.
- (ii) The UNDP combined key details into one single index so we can easily compare different countries.
- (iii) This index bridges the gap between raw economic figures and the actual everyday life of ordinary citizens.
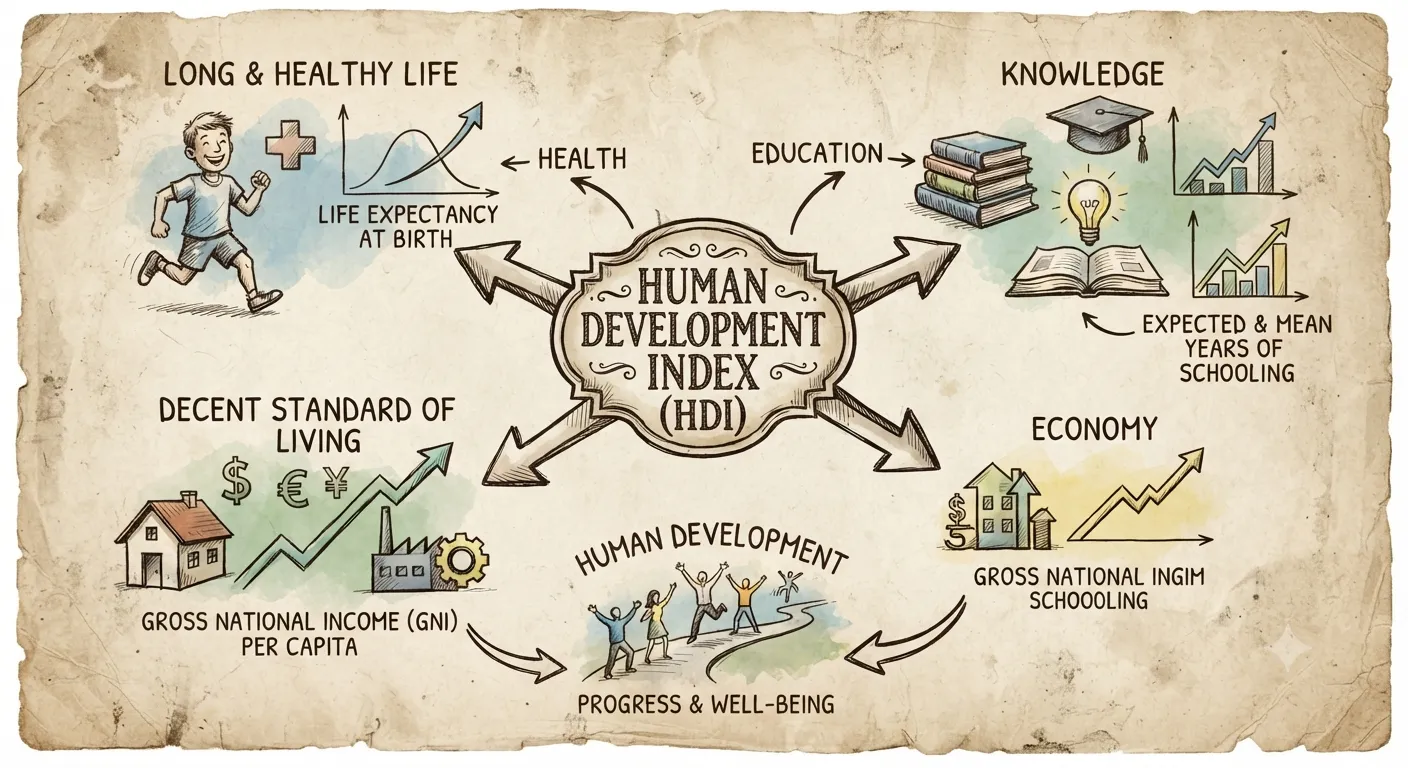
The Three Pillars of the Human Development Index Dimensions
The UNDP built the HDI as a combined index that carefully balances three basic parts of human life into one simple score. Let's look closely at these three core building blocks.
Primary Dimensions of the HDI Framework
The story of a nation's growth is told through its longevity, educational attainment, and the standard of living given to its citizens. These three pillars show how well a country nurtures its people.
(i) Longevity and Health
This is basic health and nourishment, measured directly by life expectancy at birth.
(ii) Educational Attainment and Knowledge
This part combines two important measures using a weighted calculation:
- (a) Adult literacy rate: This carries a large 2/3 weight of the overall knowledge score.
- (b) Combined gross enrolment ratio: This covers primary, secondary, and college education, carrying the remaining 1/3 weight.
(iii) Standard of Living and Economic Power
Economic power is measured using real GDP per capita adjusted for Purchasing Power Parity (PPP $) so that buying power can be compared fairly across different countries.
(iv) The Gender Development Index (GDI)
When these HDI metrics are adjusted to show gaps between men and women, the measure becomes the Gender Development Index, which points out gender inequality.
The Mathematical Architecture: Calculating the HDI Index
To keep things fair for big and small countries alike, the HDI converts raw numbers into a standard score from 0 to 1. This formula clearly highlights the shortfall of a country compared to the highest possible level in the world.
The HDI Calculation and Dimension Indexing
For any country, the traditional HDI score is calculated by taking the simple average of all three pillar scores. This means a poor score in one area will pull down the overall total, even if another area is very high.
- (i) General Formula:
- (ii) Individual Dimension Index Formula:
- (iii) This calculation scales every country's score between 0 and 1, where 1 represents the highest possible level of development.
Fixed Minimum and Maximum Values for Indexing
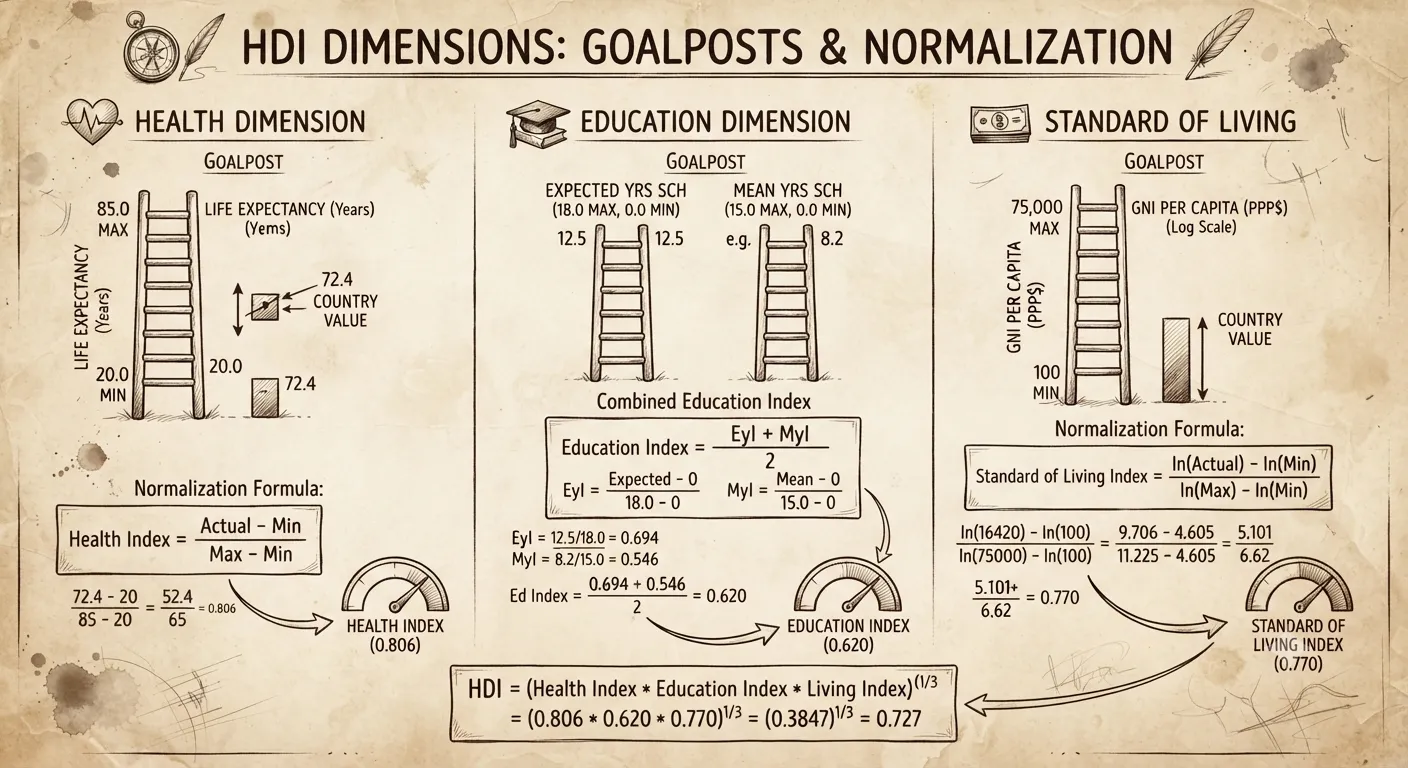
The HDR sets fixed limits (called goalposts) to calculate these scores fairly and keep the normalized scale consistent over time.
- (i) Life expectancy: Set between a minimum of and a maximum of .
- (ii) Adult literacy: Scaled from 0% up to 100%.
- (iii) Combined enrolment ratio: Scaled from 0% up to 100%.
- (iv) Real GDP per capita: Scaled from a low of PPP $100 up to a top limit of PPP $40,000.
Case Study: Analysis of India via HDR Data Metrics
We can look at real data from India to see how these UNDP formulas work step-by-step in practice. Here is how raw figures turn into an official global score.
Step-by-Step HDI Calculation for India
Using India as our main example from historical HDR numbers, we can see how the scores for health, education, and income come together into one final Human Development Index value.
- (i) Life Expectancy Index: With an average life expectancy of , the score is calculated as:
- (ii) Education Components: Adult literacy at 66% gives a score of 0.66, while a school enrolment rate of 61% gives 0.61.
- (iii) Combined Education Index: Putting these two education numbers into the weighted formula gives:
- (iv) GDP Index: For an income of PPP $2753 per person, using the income formula gives:
- (v) Final HDI Score: The final step averages these three separate values together:
⚡ Quick Revision Capsule: Global Classification Tiers
The Human Development Report 2010 divided countries into four main groups based on their final index scores. This grouping helps us spot regional patterns and highlight areas that need help.
Tiered Structure of Human Development
Countries are placed into groups to show their progress in human resource development. This helps students and leaders quickly see which regions need the most support.
| Development Tier | HDI Score Threshold | Number of Countries (HDR 2010) |
|---|---|---|
| Very High Human Development | HDI > 0.90 | 42 countries |
| High Human Development | HDI > 0.80 | 43 countries |
| Medium Human Development | HDI between 0.50 and 0.80 | 42 countries |
| Low Human Development | HDI < 0.50 | 42 countries |
📝 Summary
Understanding the Human Development Index is key to seeing how longevity, knowledge, and standard of living shape a country's growth. Created by the UNDP in the late , this framework remains essential for students learning about Human Resource Development because it offers a reliable, fair, and clear way to measure human progress across the globe using Human Development Report findings.
🚀 Quick Revision Points
Essential facts to review before examinations:
- (i) The HDI is a single combined score built from three core areas: health, knowledge, and living standard.
- (ii) The education score gives a 2/3 weight to adult literacy and a 1/3 weight to school enrolment.
- (iii) Every dimension score is scaled between 0 and 1 using set global minimum and maximum goalposts.
- (iv) When the standard HDI calculation is adjusted to reflect gender gaps, it becomes the Gender Development Index (GDI).
- 💡 Exam Tip: Remember that education weights are split 2/3 for adult literacy and 1/3 for combined school enrolment. Also remember that the final HDI is the simple average of all three dimension scores!
❓ Frequently Asked Questions (FAQ)
Q1: What are the three core dimensions evaluated by the Human Development Index?
A1: The HDI measures progress in Longevity and Health (life expectancy at birth), Educational Attainment (adult literacy and school enrolment), and Standard of Living (real GDP per capita adjusted for Purchasing Power Parity).Q2: How are weights distributed within the knowledge/education dimension index?
A2: The knowledge score gives a 2/3 weight to the Adult literacy rate and a 1/3 weight to the Combined gross enrolment ratio.Q3: What classification category does India fall into based on the historical calculation?
A3: With a calculated total score of about 0.612, India falls into the Medium Human Development group, which includes scores between 0.50 and 0.80.
For more details on global tracking, you can consult the structural mapping frameworks provided in the original content layout.