
The fiscal setup of India relies on a detailed system of money allocation that decides how public money is used for growth, daily work, and public welfare at different government levels.
🎯 In this chapter, you will understand:
- How government money is divided and categorized across different sectors.
- The changes in government spending after the economic updates of 1991.
- The balance between daily operational spending and long-term asset building.
- How spending responsibilities are shared between the Central and State governments.
💡 Why this topic matters: Public spending sets the direction for national growth, improves infrastructure, and decides how public wealth is used to help citizens.
🧠 Core Idea: Managing government money requires balancing immediate operational expenses with long-term capital investments for economic stability.
Structure of Public Expenditure in India
Assigning financial resources for public goods and services forms the base of national accounting and economic stability.
In national accounting, a clear difference is made between government final expenditure on consumer and investment goods and the movement of transfer payments. These financial steps are key to maintaining the economic stability of the country.
Classification of Public Expenditure
To measure economic impact clearly, the Government of India divides its spending into different categories, giving a complete view of how money moves through the system.
Functional and Economic Categories
The main ways to review spending involve looking at Plan vs Non-plan costs and separating developmental work from non-developmental expenses. Additionally, the split between Revenue vs Capital expenditure shows the difference between day-to-day operational costs and building long-term assets. On a larger scale, the budget is split into Civilian vs Defence expenditure, with detailed tracking done across various ministries and sectors.
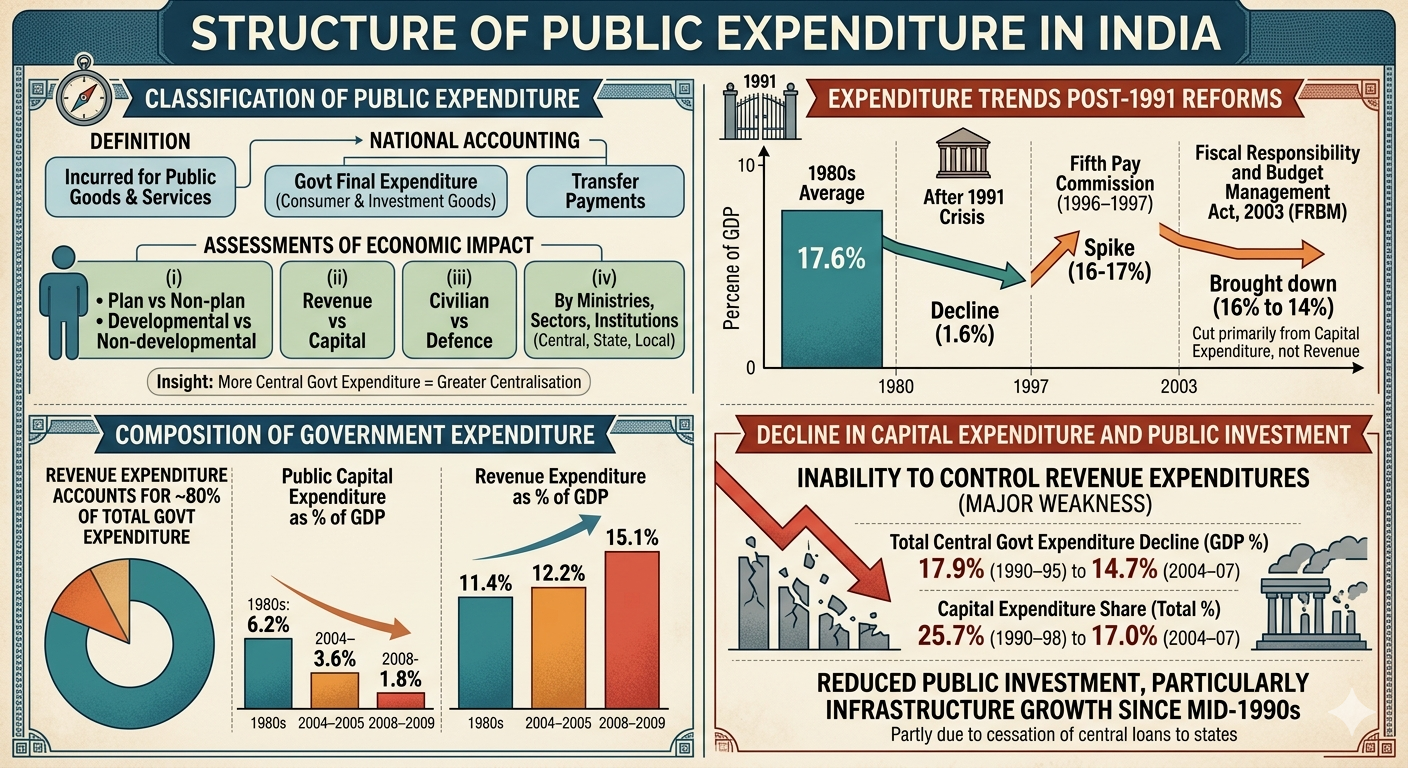
The Hierarchical Structure of Public Expenditure Categories Institutional Expenditure Framework
Financial duties are divided among the Central Government, state governments, and local authorities.
Higher central government spending often shows a stronger concentration of decision-making within the federal system.
Expenditure Trends Post 1991 Reforms
The path of India's budget policy shifted significantly after the economic changes of the early nineties, moving from spending expansion to financial stabilization.
Macroeconomic Stabilisation Impact
During the , the Central Government spent an average of 17.6% of GDP. However, the balance of payments crisis in became a turning point. Following steps to stabilize the economy, this spending dropped by 1.6% as the government reduced its budget allocation.
FRBM and Pay Commission Cycles
A short increase occurred due to the Fifth Pay Commission during , which briefly brought spending back to the 16–17% of GDP range.
The start of the Fiscal Responsibility and Budget Management Act, 2003 (FRBM) brought spending down from 16% to 14% of GDP.
These required spending cuts were mainly taken from capital expenditure rather than rigid revenue expenditure.
Composition of Government Expenditure
The inner structure of the budget shows a heavier focus on daily operations rather than long-term investment, with Revenue expenditure making up about 80% of total government spending.
Capital vs Revenue GDP Ratio
The pattern of public capital expenditure as a share of gross domestic product shows a drop over time. It stood at 6.2% during the , dropped to 3.6% by , and reached a low of 1.8% in .
Rising Revenue Demands
In contrast, revenue spending as a share of GDP increased over time.
From 11.4% in the , it grew to 12.2% in and reached 15.1% in .
Decline in Capital Expenditure and Public Investment
A continuous challenge in financial management has been the difficulty in controlling daily operational costs, which leaves less money for investment.
Structural Shifts in Spending
Even with tax and spending changes introduced after the stabilization efforts of the , total Central Government expenditure dropped from 17.9% of GDP during 1990–95 to 14.7% during 2004–07. Within this overall reduction, the share of capital spending fell from 25.7% to 17.0% during the same period.
Infrastructure Consequences
Part of this statistical drop happened because central loans to states stopped being listed under capital spending.
Overall, the reduction in capital spending led to lower public investment, which slowed down infrastructure growth after the mid-.
Combined Expenditure of Centre and States in India
Looking at the entire economy, combining the spending of the central government and state governments gives a clearer view of national spending priorities.
Expenditure as Percentage of GDP (Revenue + Capital)
Total public spending has changed across decades, reflecting shifts in political and economic goals across three major periods.
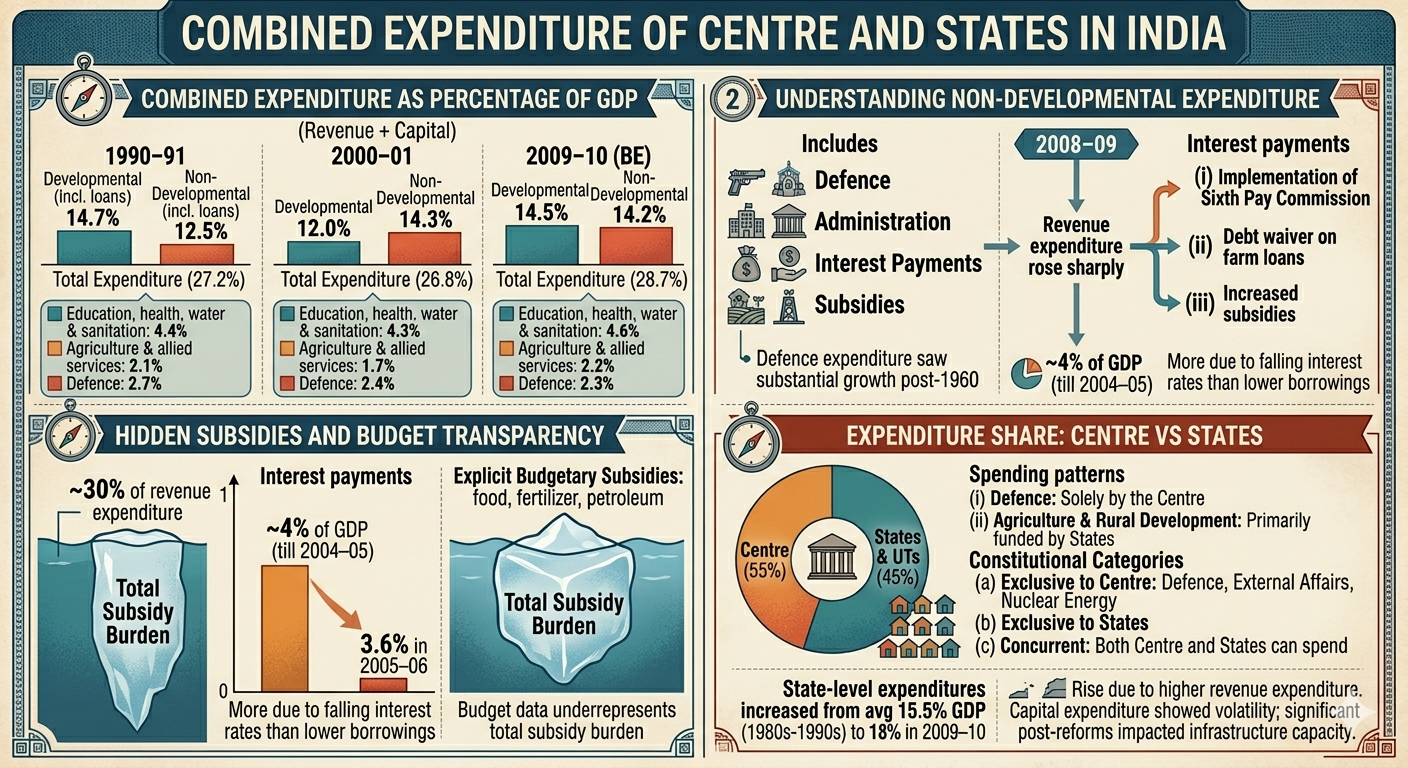
Analysis of Combined Fiscal Expenditure: Centre and States Fiscal Snapshot: 1990 to 2010
In , total spending stood at 27.2%, with developmental spending at 14.7% and non-developmental spending at 12.5%. Key social areas like education and health received 4.4%, while defence took 2.7%.
By , total spending fell slightly to 26.8%, but developmental spending dropped further to 12.0% while non-developmental expenses rose to 14.3%.
In the budget estimate for , total spending grew to 28.7%, showing a recovery in developmental spending to 14.5%, with agriculture receiving 2.2% of GDP.
⚡ Quick Revision Capsule: Public Expenditure Highlights
Key metrics showing how public spending shifted across important economic periods:
| Time Period / Indicator | Total Spending (% of GDP) | Key Expenditure Characteristics |
|---|---|---|
| 1980s Average | 17.6% (Central) | Higher average central spending before post-1991 stabilization. |
| 1990–91 | 27.2% (Combined) | Developmental expenditure stood at 14.7%; non-developmental at 12.5%. |
| 2000–01 | 26.8% (Combined) | Non-developmental costs rose to 14.3% while developmental fell to 12.0%. |
| 2004–2005 | 14.7% (Central) | Capital spending fell to 3.6% of GDP due to budget tightening. |
| 2008–2009 / 2009–10 | 28.7% (Combined BE) | Revenue spending peaked at 15.1% while capital spending hit a low of 1.8%. |
Understanding Non-Developmental Expenditure
This category covers basic administrative costs that do not directly add to economic expansion.
Drivers of Non-Developmental Growth
Main areas include defence, administration, interest payments, and subsidies. While defence expenses grew after the , a noticeable rise in daily operational costs happened in .
Debt and Subsidies
The launch of the Sixth Pay Commission, debt relief for farm loans, and higher subsidies caused this increase.
Interest payments remained a heavy cost, taking up about 30% of revenue spending. Although this share dropped to 3.6% of GDP in , the drop was mainly caused by lower interest rates rather than a reduction in total borrowing.
Hidden Subsidies and Budget Transparency
Clear reporting in budgets remains a challenge, as official figures often show less than the actual subsidy cost borne by the government.
Explicit vs Implicit Costs
While the budget lists direct subsidies for food, fertilizer, and petroleum, these make up only a small part of total financial support provided by the government.
Intermediate Subsidy Impact
Many subsidies are built into the costs of goods and services used in production, making the actual cost of running government programs harder to calculate precisely.
State vs Central Government Expenditure Trends
The balance of spending between the Central Government and state governments has shifted toward states in recent decades.
State-Level Fiscal Expansion
State spending grew from 15.5% in the to 18% in 2009–10, driven mainly by higher daily operational expenses. However, building infrastructure suffered because capital spending remained unstable and fell after the economic reforms.
Divisional Spending Responsibilities
The Central Government manages about 55% of total public spending, while state governments and Union Territories handle 45%.
Responsibilities are clearly divided: Defence is managed only by the Central Government, while Agriculture and Rural Development are mostly funded by State Governments.
This division follows legal frameworks: central responsibilities (like external affairs and nuclear energy), state responsibilities, and shared responsibility sectors.
📝 Summary
The structure of public spending in India demonstrates a constant balancing act between building long-term infrastructure and meeting short-term daily operational costs. While budget rules like the FRBM Act introduced financial discipline after , the resulting squeeze on capital spending impacted national infrastructure growth. Moving forward, coordination between the Central and State governments remains essential for managing public wealth effectively.
🚀 Quick Revision Points
Essential facts to review before examinations:
- (i) Revenue expenditure covers day-to-day operational expenses, while capital expenditure creates long-term physical assets.
- (ii) Spending cuts following the FRBM Act of 2003 mostly affected capital spending rather than daily operational costs.
- (iii) Non-developmental spending includes expenses like interest payments, defence, and administrative costs.
- (iv) Public spending is shared between central and state governments based on roles outlined in the Constitution of India.
- 💡 Exam Tip: When answering questions on public finance, clearly distinguish between capital and revenue expenditure and highlight how FRBM targets affected public investment.
❓ Frequently Asked Questions (FAQ)
Q1: What is the primary difference between revenue and capital expenditure?
A1: Revenue expenditure covers regular operational costs like salaries and interest payments, while capital expenditure builds long-term physical assets like highways and hospitals.Q2: How did the FRBM Act of 2003 influence government spending?
A2: The FRBM Act aimed to limit fiscal deficits, which led to a reduction in total central spending relative to GDP, mainly by lowering capital investment.Q3: How is public expenditure divided between the Centre and the States in India?
A3: The Central Government handles about 55% of total public expenditure, focusing on national areas like defence, while State Governments manage roughly 45%, focusing on regional areas like agriculture and local development.
